

By Margaux Gérard, Lidia-Ana-Maria Baciu, Adrian Gonzalez Carpintero, Omar Safwat
The research department at Dataroots hosts twice a year its RootsAcademy, an initiation program that prepares its students for their career as consultants in data and AI. After the academy, the consultants take on their first internal project at Dataroots, with the aim of putting the concepts learned through the academy into practice. This March, we have been doing a proof of concept to automate the deployment of a weather nowcasting model on a Nvidia Jetson nano.
Weather nowcasting is all about being able to make predictions for weather conditions in the near future. Although predicting the future is always a challenge, the biggest one we have faced is the deployment of this prediction model on the edge. In this blog post, we will walk you through how we set up our entire project to be able to make predictions on the edge device for the following four hours.
Overview of the project
Our objective is to build an end-to-end project, automating the training of a model on the cloud, and the deployment on an edge device. This would include collecting, storing and processing data in the cloud before deploying the model to the device. This model would then be able to perform the task of delivering weather predictions, four hours later from the moment of data collection, with little to no delay.
To do this, we set up the project as illustrated in the diagram below.
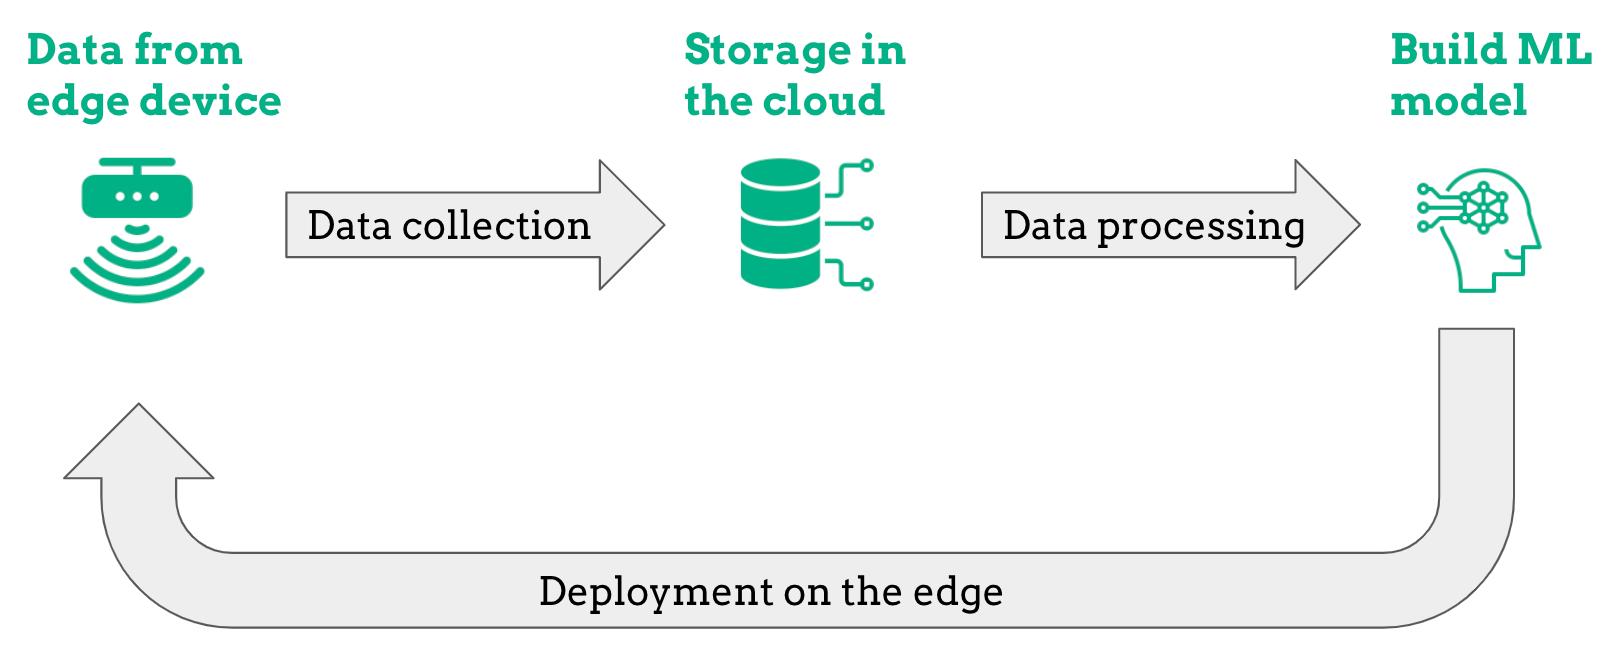
To give an overview, we begin by collecting data using an edge device, which will also be used to make weather predictions. Of course, given the size of the data, it is then sent to the cloud service provider to train the machine learning model, and we chose Microsoft Azure for this project. In the following sections, we will go over each stage of the project in greater detail.
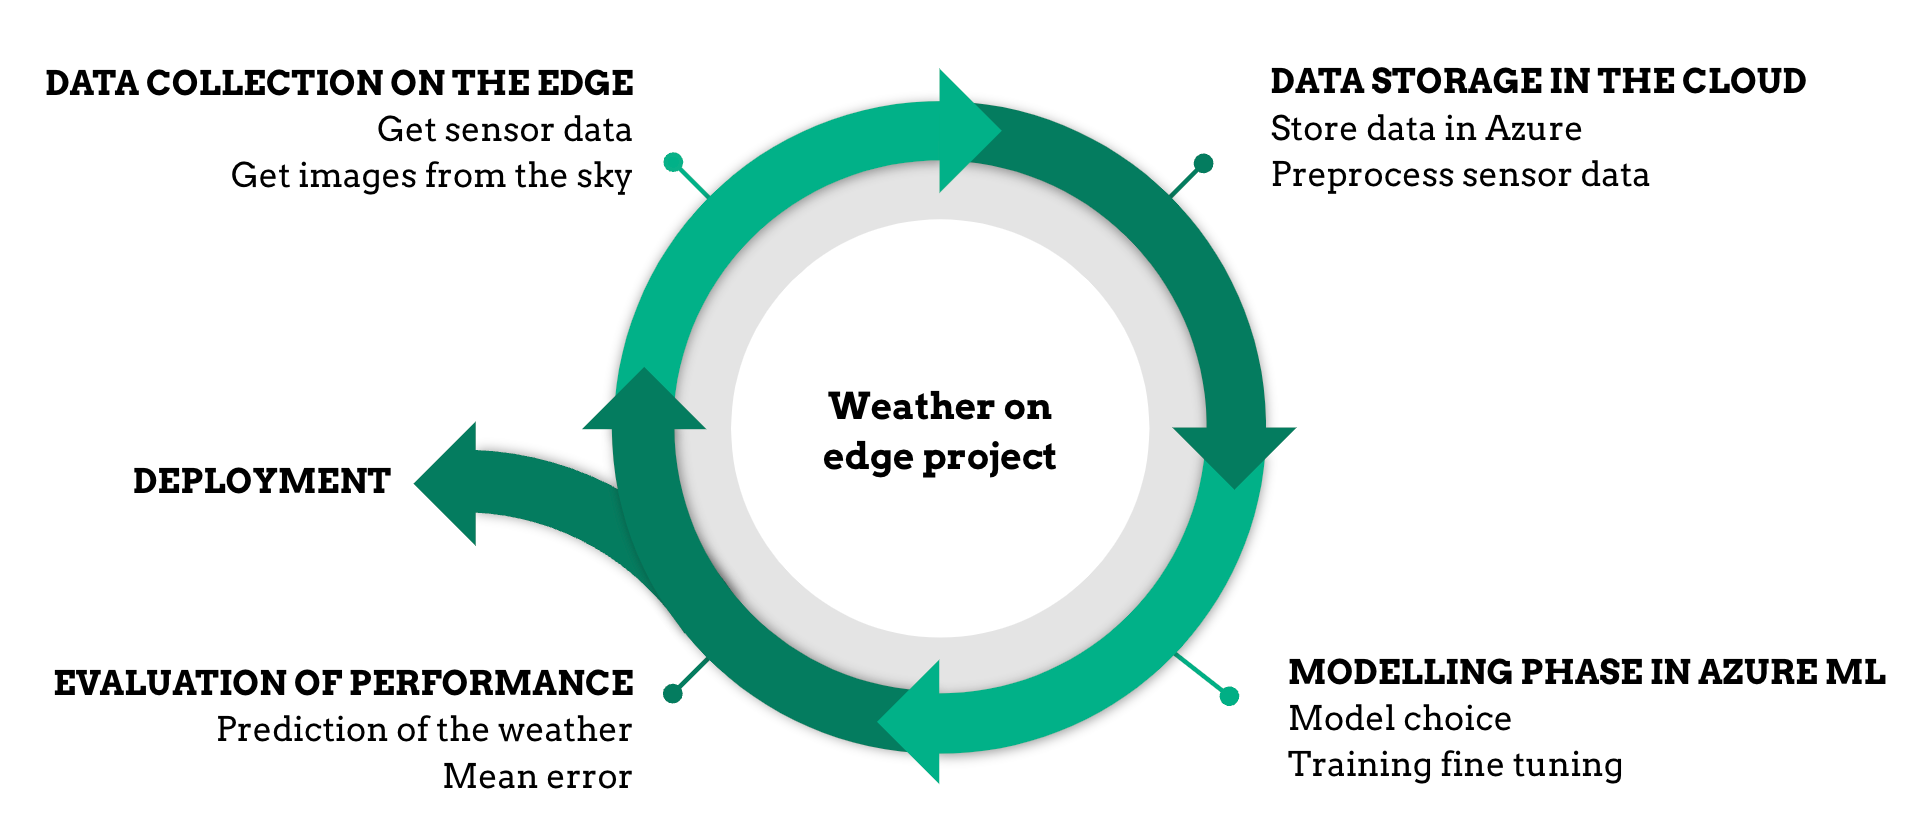
For this one-month project, we structured ourselves into three teams as follows:
- Team 1 - “The edge team”, is a team consisting of 2 consultants, with the mission of setting up the edge device for collecting data, sending it to the cloud, and the deployment of the machine learning model.
- Team 2 - “The cloud team”, a team also consisting of 2 consultants. The cloud team was responsible for completely setting up the cloud infrastructure, and services to receive, and store the data. They also instantiated the resources and the environment needed to train the machine learning model.
- Team 3 - “The machine learning team” consisted of 3 consultants. Now that the data is collected and stored, it’s the machine learning team's job to build the model, train and optimize it, and do all that is necessary to make sure that its performance is maintained in the production environment.
Data collection on the edge device
The edge device is responsible for two main tasks: collecting data from sensors and making predictions based on that data. After that, the sensor data and predictions should be sent to the cloud. In this section, we will first discuss the setup for the edge device before delving into the architecture chosen to perform the tasks.
Set-up for the Edge device
We use a Nvidia Jetson Nano as the edge device. This device comes with a GPU optimized by Nvidia which makes it ideal for performing inference on the edge. It also comes with a set of sensors already installed.
As we gather our own data, we have to install the corresponding hardware. We can divide it in two types:
- Sensor data: We collect sensor data from 6 different sources: temperature, humidity, light, atmospheric pressure, ultraviolet rays, and infrared sensors. All of these sensors are already installed in the Jetson Nano. However, we had to install an external sensor for temperature and humidity for two main reasons: firstly, the temperature sensor attached to the Jetson gives erroneous data because it collects the temperature of the Jetson when it heats up. Secondly, with external sensors for humidity and temperature, we can have a physical installation where these sensors are outside while the device can remain inside.
- Images: We collect images of the sky with a Raspberry Pi Camera Module 2.
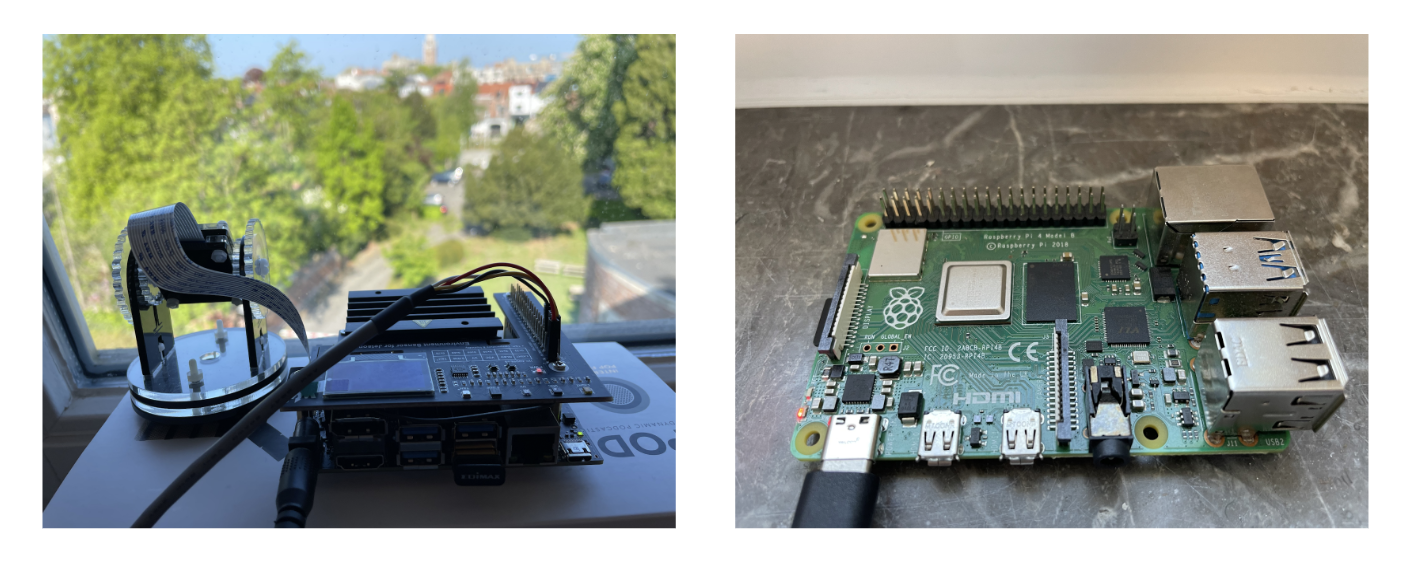
Additionally, we will have a Raspberry Pi as a self-hosted runner in order to run the CI/CD pipeline with GitHub actions. As of today, GitHub does not provide free runners with ARM architectures, so this solution was the most convenient for us. However, in a real production environment with a scalable solution this can be replaced.
Architecture of the Edge device
As mentioned, there are two main processes running in the edge device. In this section, we will dive into the architecture required to run them. First, let's give them a definition:
- Telemetry: In this process, we gather data from the sensors every second and sky images from the camera every 10 minutes. Once we gather the data, we send it directly to the cloud for processing, followed by the inference process to make predictions.
- Inference: In this process, we receive data from the Telemetry process as input and we make predictions thanks to a trained ML model. We then send those predictions to the cloud.
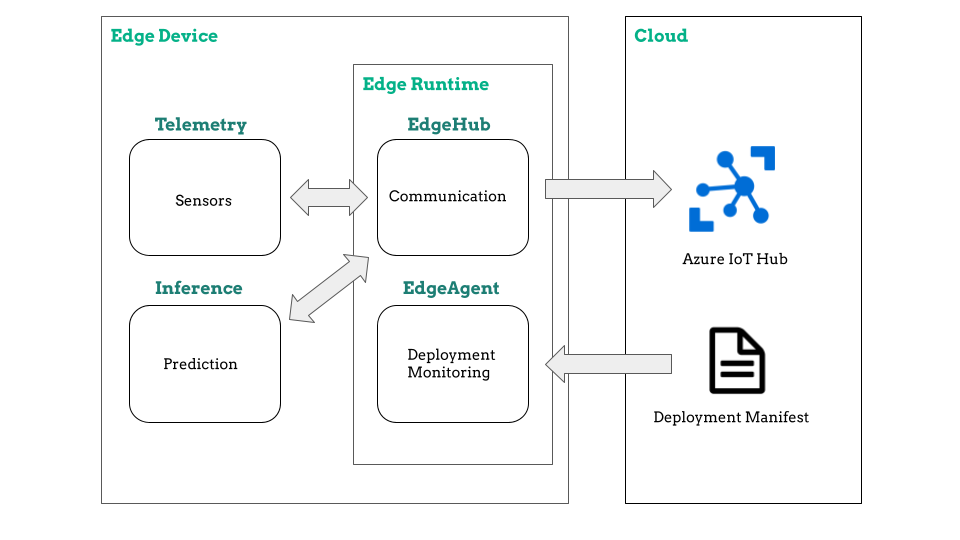
In order to build this solution we work with Azure IoT Hub, a tool provided by Microsoft Azure in order to work with IoT devices and connect them to the cloud. The architecture used for the edge device can be represented in the following diagram:
In this architecture there are two main concepts related with Azure IoT Hub that we have to understand clearly: the modules and the deployment manifest. Let’s dive into each of them.
IoT Hub Modules
In our solution each of the processes (Telemetry and Inference) is encapsulated in a Docker container. However, when working with Azure IoT Hub, we work with modules instead of containers. A module has all the capabilities of a container, and in addition the dependencies for an integration to the Azure environment. With modules we can, for example, send data to the cloud, enable routing between modules or pull images from Azure Container Registry (ACR).
The most important feature when talking about modules is the IoT Edge runtime, which is a collection of programs that enable the communication between the device and the cloud. The IoT Edge runtime is composed by two modules: the IoT Edge agent and the IoT Edge Hub.
- IoT Edge agent: is responsible for deploying and monitoring modules.
- IoT Edge Hub: acts as a local proxy for IoT Hub enabling communication between the edge device and the cloud.
Therefore, our solution is composed of four modules: the Edge agent and Edge Hub provided by Azure, and the Telemetry and Inference modules that we created. The communication between the latter two is performed via MQTT for the sensor data and via Docker Volumes for the images. It is also worth mentioning that we built both modules on top of a Docker image provided by Nvidia, containing all the dependencies of the Jetson Nano.
IoT Hub Deployment manifest
To set up the modules, we use a deployment manifest, which is a JSON file in which we can specify all the configuration for setting up our modules and the communication between them. For example, we can specify the configuration for the containers (bindings, privileges...), the different routes the data will follow, the images to pull from Azure Container Registry, etc. Everything that we deploy in the device is defined in this file. Therefore, the deployment step only involves the execution of this file. When doing so, the IoT Edge runtime will look at the Azure Container Registry, download the container images, and deploy the modules on the edge with all the specifications.
This approach is a great solution, but it also has some drawbacks, as it requires a common environment for all developers to update the file, which is not ideal if you are working with other teams or if the client wants access. To solve this, we can store the deployment manifest in an Azure Storage account and access it through an API, enabling the same file and environment for all. Once the file is edited, we trigger its execution to make the deployment on the device.
With this approach we won’t have the whole CI/CD pipeline in the same environment, so we have the flexibility to choose between the two strategies depending on the circumstances. If we work alone in one environment and choose the whole CI/CD pipeline, it will work as follows: every time we push new code to GitHub, a Github action process will be triggered to build the images, push them to ACR and deploy the modules with the deployment manifest.
On the other hand, if we want a common deployment environment accessible to different teams, we can work with the API and still perform continuous integration with GitHub actions.
Data storage in the Cloud
Because the edge device collects and sends a large amount of data, it is critical that this data is stored in the cloud. It would be impossible to store so much data on the device itself. Furthermore, we will later train a Machine Learning model using this data, so it has to be saved somewhere accessible.
As a result, the main goal of the Cloud Team was to set up the infrastructure and resources required to store and prepare the data sent by the edge device. The following figure depicts an overview of the architecture of the resources that were created during this project.
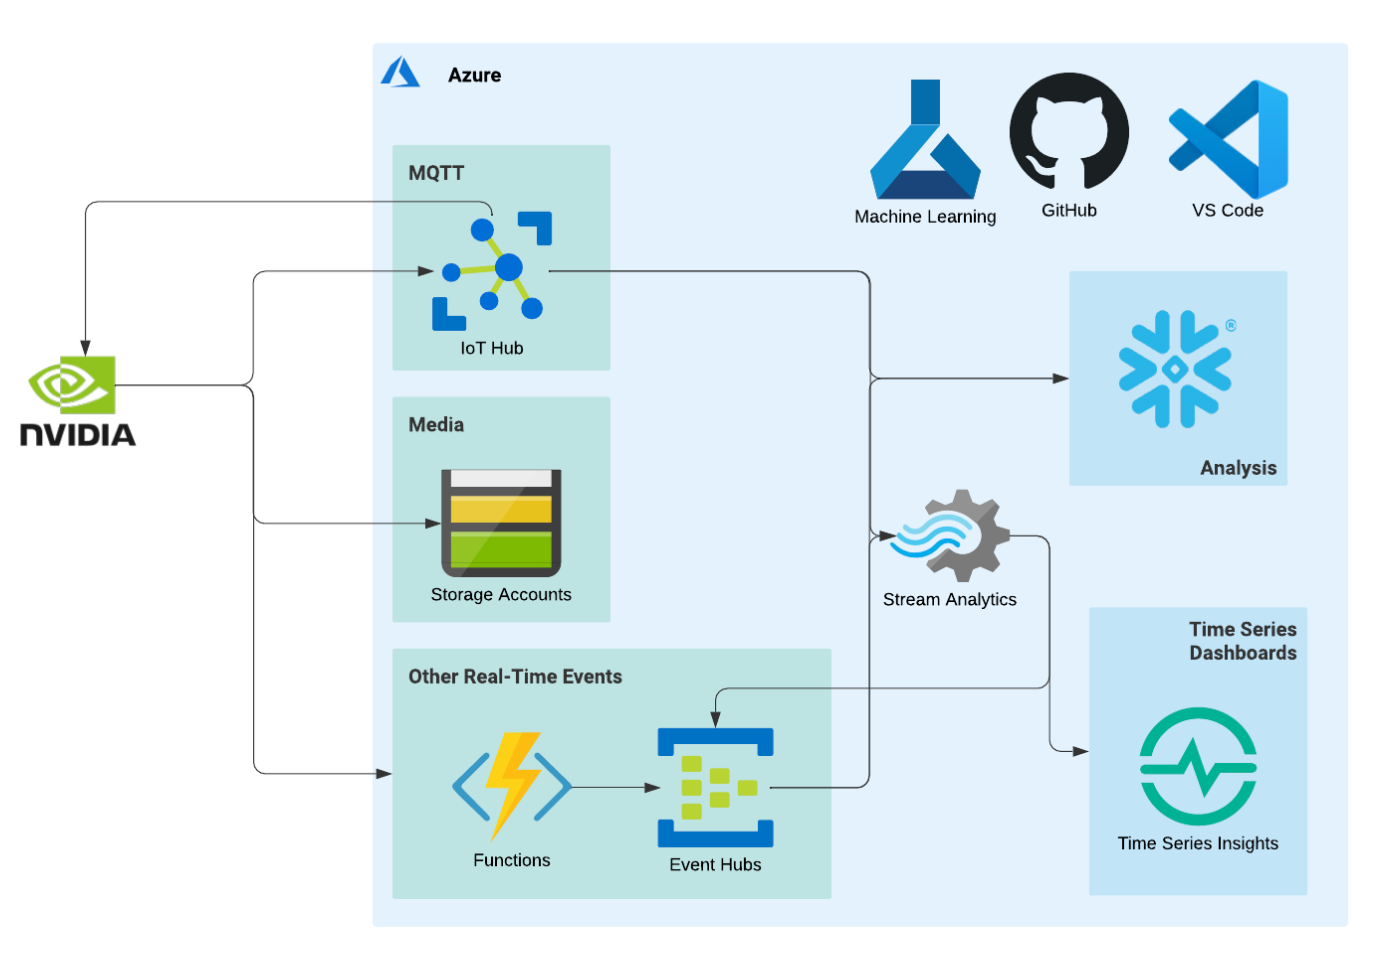
From the edge to the cloud
As mentioned in the previous section, the data sent by the edge device every second is received by the IoT hub. It is in this resource that the data is separated according to its type (e.g. prediction or weather measurement), based on the endpoint used, before being stored in a storage container.
The writing of the data into a storage container is scheduled every 5 minutes using the Event Grid System Topic as a resource. We chose this time frame to avoid writing data every second.
Then, Snowflake retrieves the data from the storage account and stores it in different tables that are ready to be used by the Machine Learning team. Whenever a new file is created in a given storage container, Snowflake gets notified and stores the data in the designated table. At the end of this step, the Machine Learning team is able to use the data.
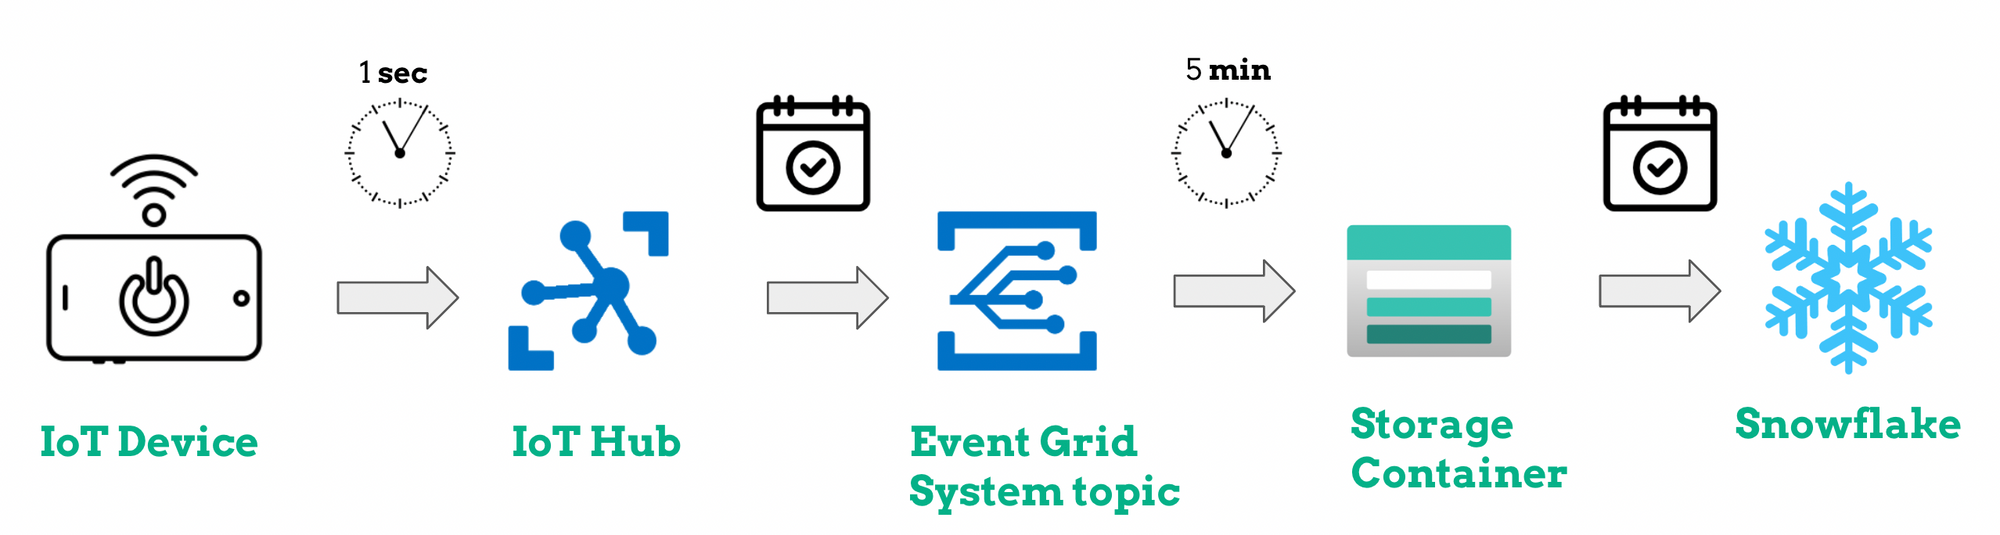
Images from the sky are not sent to the IoT Hub; instead, they are stored directly in a storage container and can therefore be used by the Machine Learning team.
Different environments
All these resources are created in multiple environments to ensure that our code is rigorously tested before it is deployed. We used three deployment environments:
- Development environment: usually called "dev", is the environment in which changes to software are developed.
- Staging environment: also called pre-production environment, is a testing environment that looks exactly like a production environment. We deploy to the staging environment automatically on every push to our GitHub repository.
- Production environment: also called "live", is the environment with which users interact directly. Deploying to production is the most sensitive step, thus happens only when a new version is released.
For the time being, the edge device is only connected to the production environment. However, it would be ideal to use cloud-based VMs to simulate the device and to be able to test the edge modules in development and staging environments before deploying it in the production environment. This elegant solution allows to mimic a fleet of edge devices and test the deployment strategy with minimal infrastructure investment. This solution was not implemented in this short project but it will be the subject of an upcoming internship at Dataroots.
Automation of the creation and maintenance of resources
We first started by setting up all the resources needed by the other teams, in order to facilitate a fast start. Only after this was done, we moved our attention to the automation of creating and maintaining these resources. In order to achieve this, we have combined two powerful tools: a CI/CD pipeline & Terraform.
Terraform is an open-source infrastructure-as-code software tool that allows you to define cloud resources in human-readable configuration files that you can version, reuse, and share. We will have a dedicated article on how to instantiate Snowflake with Terraform.
When the code changes, the CI pipeline runs, and its role is to ensure that any changes made work with the rest of the code when it is integrated. We have three different steps in our CI pipeline that correspond to actions on GitHub:
- Pre-commit: When new code is committed, we automatically check if the linting of the code is correct, thanks to two well-known libraries: isort and black.
- Pull request: When a pull request is created, we run some tests to ensure that the new code passes all the tests and we check the formatting. Then, we initialize a working directory containing Terraform configuration files, we ensure that all of these files are in the canonical format and we create an execution plan. This last step allows us to preview the changes that Terraform plans to make to the staging infrastructure.
- Merge: When a pull request is merged to the main branch of the GitHub repository, we execute the actions proposed in the Terraform plan to create, update, or destroy infrastructure in the staging environment. We also preview the changes that Terraform plans to make to the infrastructure of the production environment.
The CD pipeline's goal is to deploy the built code into production. The deployment to the production environment is triggered by a push tag on the GitHub repository. This means that we carry out the Terraform plan's actions to create, update, or destroy infrastructure in the production environment.
Modelling and evaluation of performance
In the previous sections we saw how data is sent through the edge device and then stored in the cloud. It is now time to explain how the Machine Learning (ML) model is created.
Overview of the ML prediction model
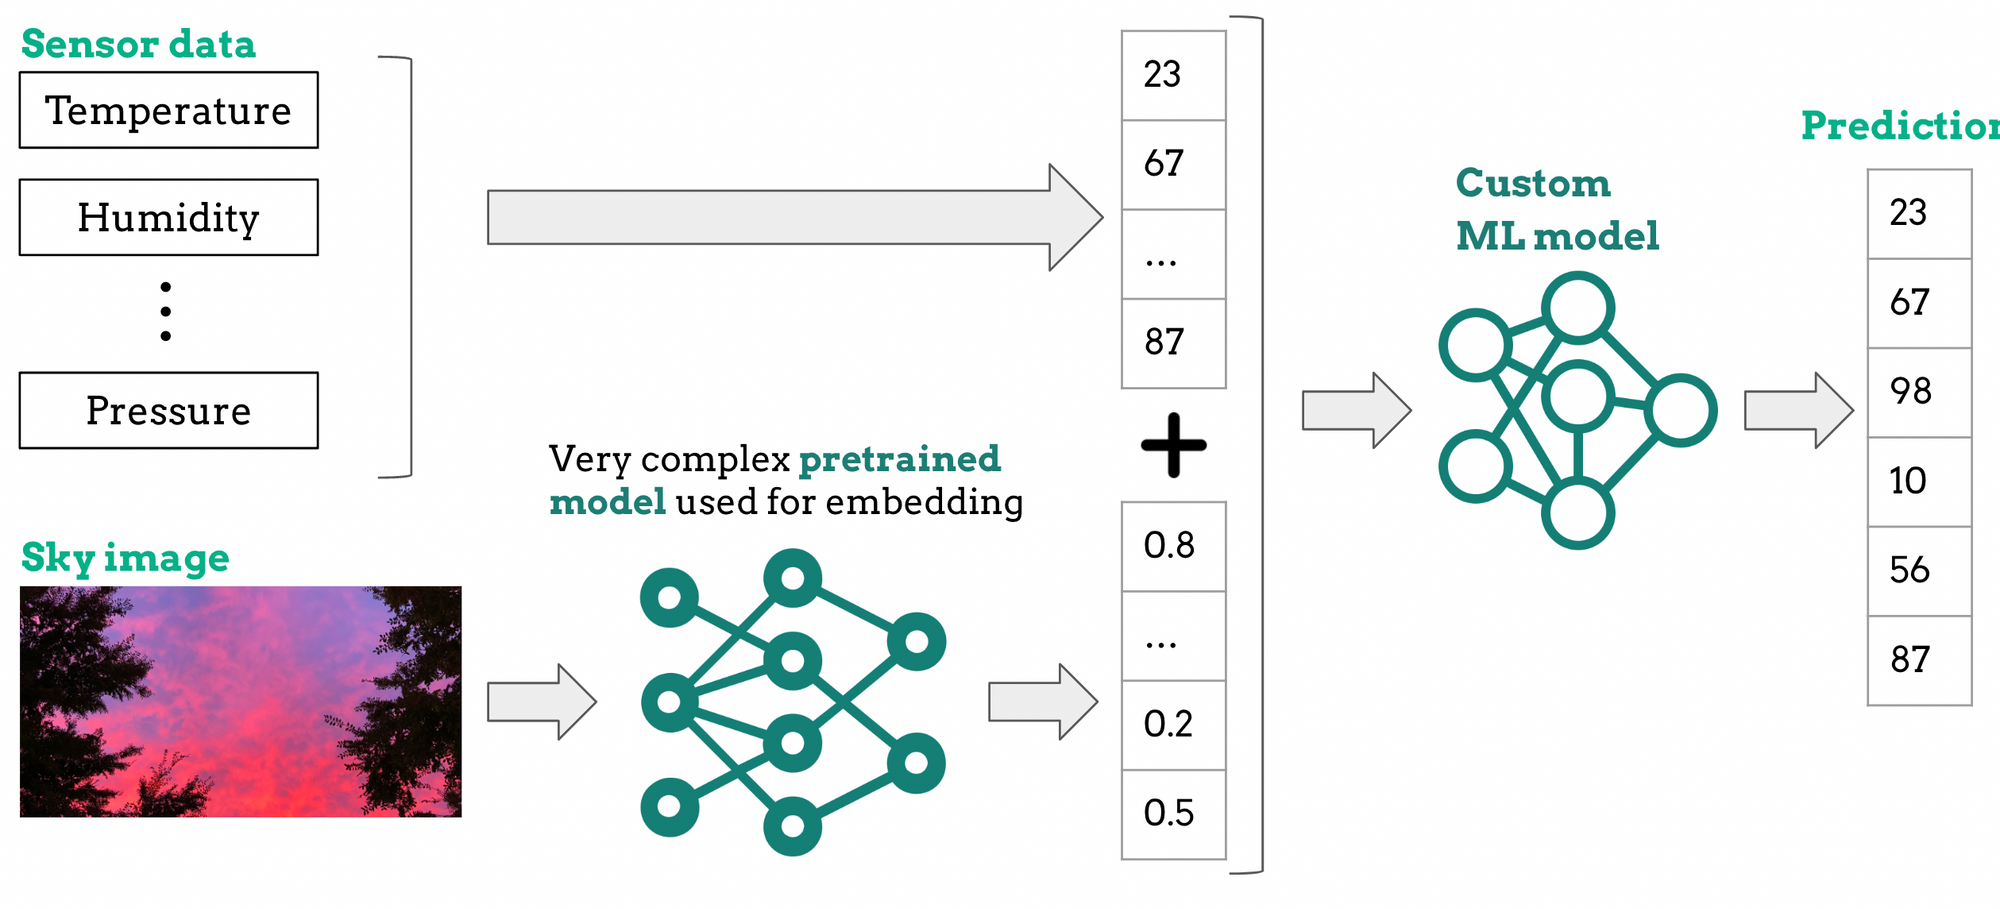
To recap, we received two types of data: sensor data and images from the sky. Because the sensor data is numerical (e.g., temperature and pressure), it can be easily processed and interpreted by any ML model.
On the other hand, processing and interpreting images is not as straightforward as it is with numerical data. The solution we came up with is to convert images into numerical vectors. This process, known as embedding, is enabled by a highly complex computer vision pre-trained model. If you want to learn more about this model and its compression, keep an eye out for the next blog post, which will be published soon.
Now that we have a numerical representation of the sky images, we can join it to the numerical vector containing the sensor data. This joined numerical vector will then be fed into a custom Machine Learning model (e.g., a Random Forest Regressor, another neural network, etc.) that will attempt to forecast the weather for the next four hours. The figure below depicts an overview of the ML prediction model.
To build an effective prediction model, we must first train it with a large amount of data. That is why, training this prediction model directly on the edge device is impossible.
As a result, because the sensor data and sky images are stored in the cloud, we will prepare the data and train the prediction model there. To achieve this, we created two distinct Azure ML pipelines.
Data collection pipeline
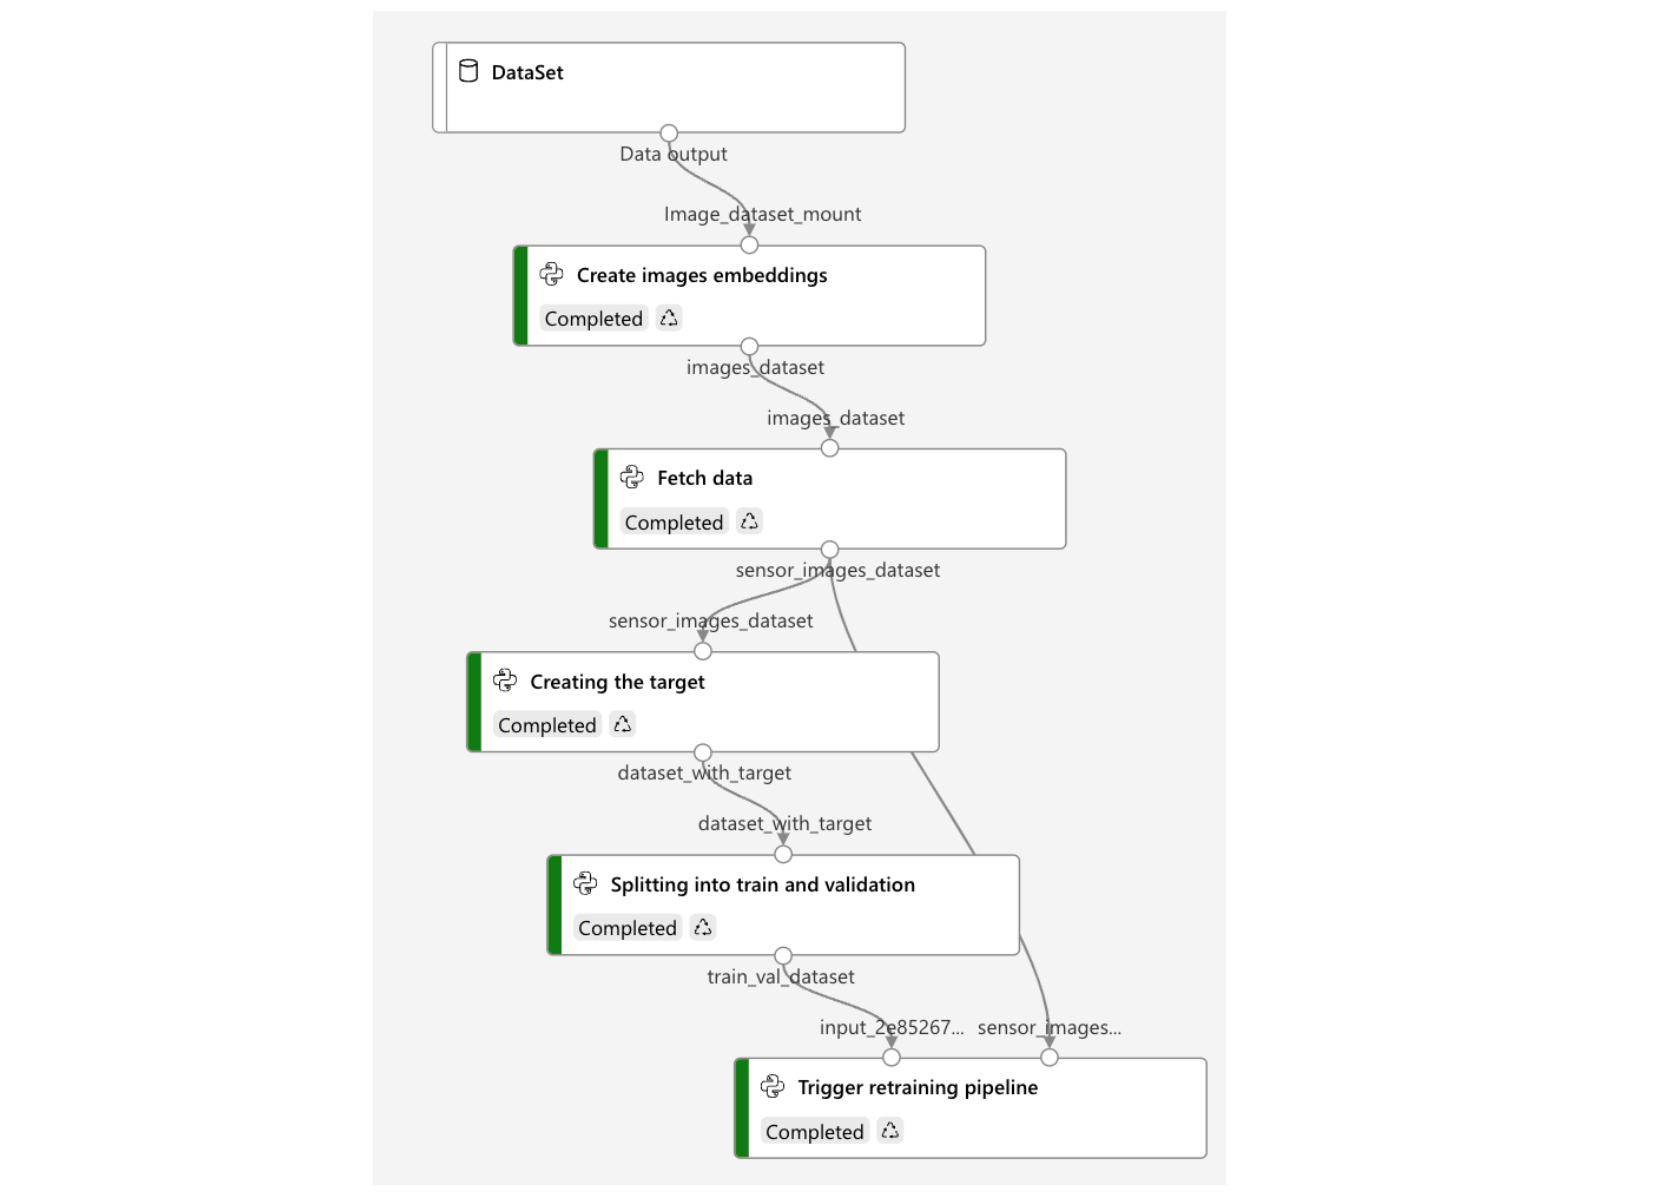
This Azure ML pipeline's goal is to collect data on a daily basis and transform it so that it can be used to train a new machine learning model. This pipeline is made up of five steps, which will be discussed in this section.
- Create image embeddings: The aim of the first step is to create image embeddings, i.e. to transform the sky images into a numerical vector that can be used as input of a ML model.
- Fetch sensor data: We retrieved the sensor data collected and stored by the Cloud team in ready-to-use tables from Snowflake. The data was then combined with the image embeddings created in the previous step. This enables us to obtain a single numerical vector containing both sensor data and information about sky images.
- Create target variables: We defined the six sensor variables that should be predicted over the next four hours, which is critical because we are developing a supervised machine learning model.
- Split data into train/validation sets: We divided the data into two sets: training and validation. Data splitting is an important part of evaluating the performance of ML models. In order for the model to be effective, it is essential to have a good balance in the weather observed in the training data. It is also important that the validation set is balanced so that the performance can be evaluated correctly. This is why we have separated the data randomly on each day, which means that we do not always consider the same times of the day in both sets.
- Trigger retraining pipeline: Finally, we need to determine whether the model currently deployed on the edge device is adequate or whether it needs to be retrained with new data. To determine whether the model is still valid, we examine the predictions sent in real time by the edge device. If these predictions are far from reality, we initiate the retraining pipeline described in the following section.
Retraining model pipeline
This Azure ML pipeline is used for retraining a machine learning model and is triggered when predictions made on the edge device are not good enough. This can happen, for example, when the model faces weather conditions it has never encountered before. This pipeline is composed of two steps that can be defined as follows:
- Training the model: The first step is to train the model on the latest data, which is collected using the pipeline that was described in the previous section. When the new model is trained, we store it in the Azure Model Registry.
- Performance evaluation: Now that we have a new trained model, we must assess its performance to determine whether it should be deployed on the edge device or if the currently deployed model performs better. On validation data, we compare the error of the deployed model and the error of the new model. If the new model is the best, it is deployed on the edge device. Otherwise, no deployment is triggered.

Conclusion and next steps
In this article, we explained the whole process of performing inference on the edge for a weather nowcasting use case.
We described the set-up of the edge device as well as the needed architecture to collect the data from the sensors and perform the inference.
Afterwards, we talked about the infrastructure and resources needed to process the data from the edge device and store it in Snowflake, as well as the automation of the entire process.
Finally, we proposed a Machine Learning model and explained the different pipelines to collect and transform the data and to trigger the retraining of the model.