

By Stijn Tans
Companies are connecting AI agents to their data platforms, and those agents read the same column descriptions as your analysts. But when a description is missing or wrong, the agent still answers without asking for more context, and it sounds sure of itself. We built a tool for agents that documents Power BI, dbt, Unity Catalog and Confluence, so we can unify all that organizational knowledge and avoid missing gaps and wrong decisions.
That raises two questions for the tool we wanted to build: what can it actually learn from each platform, and what should it write when a source has nothing to document? This post covers how we answered both, and why Power BI made the first one harder than expected.
Documentation needs a second reader
Every data team struggles with the state of its documentation. It is out of date, it lives in three places that disagree, or a colleague who has since left wrote it before. Writing it is slow work and often ends up at the end of the backlog.
For years, the cost of that gap was an analyst who asked around or guessed based on its own knowledge. Today the same gap feeds every AI agent that queries the warehouse or answers questions over a semantic model. An agent reading an unclear column name produces a fluent answer regardless, and a wrong number inside a convincing answer is even harder to spot than a wrong number in a spreadsheet.
We wanted to know whether Claude could write documentation a data team would rely on, across the platforms a typical analytics stack combines.
One tool, one connector per platform
We built a Python command-line tool with a connector for each platform. Each connector pulls metadata from its source, passes it to Claude with a strict prompt and writes Markdown or YAML.
• Power BI covers datasets, reports and dataflows. It combines the REST API with the schema inside the .pbix file, and adds rendered report pages when the workspace runs on Premium or Fabric capacity.
• dbt writes .yml documentation for models and columns from the model SQL, a small sample of rows and the descriptions already in the manifest. It keeps existing descriptions and adds to them.
• Unity Catalog produces catalog YAML and a readable page per table.
• Confluence turns wiki pages into structured Markdown with their metadata and hierarchy intact.
One page per table
The most useful output combines three sources. For each table, one page shows where the data comes from in dbt, what Unity Catalog records about it and which Power BI reports depend on it. An analyst who plans to change a column sees the affected reports before touching anything, and an agent finds the same context in one place.
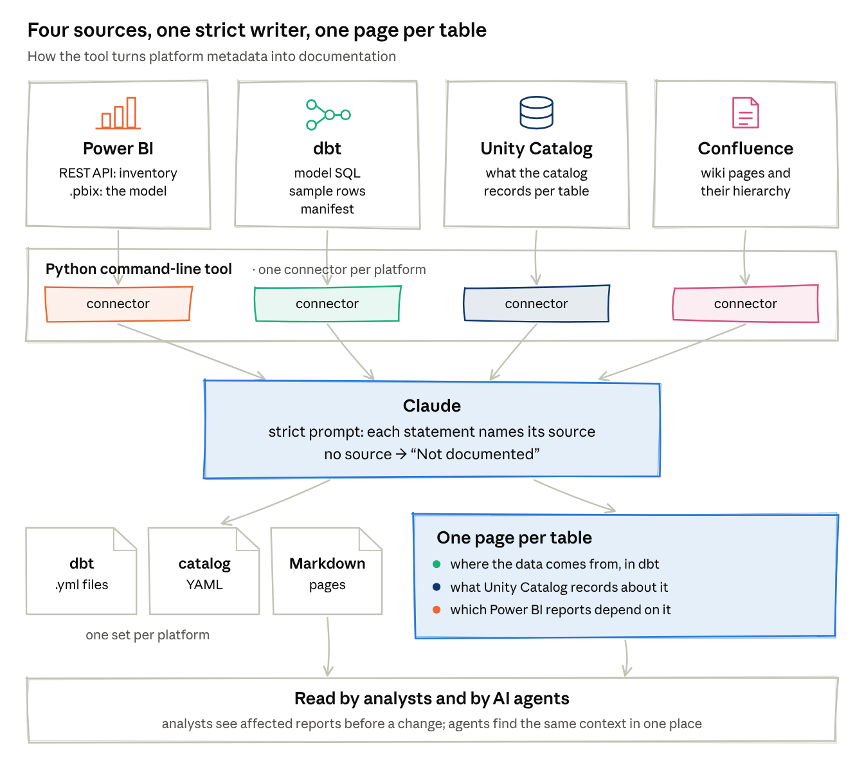
how the tool works · 4 sources, 1 writer, 1 page per table
The Power BI API stops at the inventory
Our plan for Power BI was to call the REST API, list every dataset and pull its tables, columns, DAX measures and relationships.
The inventory came back without trouble: workspaces, datasets, reports, owners and refresh times. The contents of each dataset did not. On standard workspaces, the API returned no tables, columns, measures or relationships.
The workarounds we tried for reading the model through the service did not close that gap either.
After the first round, our Power BI documentation listed names and little else.
The .pbix file holds the model
A .pbix file packs the report and its data model into one binary, and the open-source pbixray library reads it. Parsed locally, the file gave us the tables, columns, DAX measures, calculated columns, relationships, Power Query (M) code and the visuals on each page.
The Power BI connector now uses both sources. The REST API supplies the inventory and the operational metadata, and the .pbix supplies the model. For a team that wants to document Power BI, the practical first step is to collect the .pbix files.
We also replaced the interactive Azure CLI login with a service principal, so the tool can run on a schedule and avoid stale documentation in the future.
Beyond Power BI
dbt exposes a lot of metadata on its own. The manifest and the model SQL describe lineage, column types and existing descriptions, and the tool uses them to complement what the other platforms provide.
Querying the data itself also adds proof for the agent. A sample of real values confirms what a column holds and often tells more than its name, for example which codes it uses.
Unity Catalog and Confluence bring in the business view. Both give business users a familiar place to add context, and the tool carries that context into the documentation.
Claude writes only what the sources say
Ask a language model to document a column called cust_seg_cd and it will write a confident description of customer segment codes. It may even be right. A plausible but wrong description does more harm than an empty field, because people believe it.
Every connector therefore follows the same rules. Each statement carries the source it came from, whether that is the SQL, the sample rows, the manifest, the API or the .pbix. When a field has no source, the output says "Not documented".
This rule matters most for Power BI. With a matching .pbix, the page is complete. Without one, the tool documents what the API returned and states that the model details are missing, so readers always know which case they are looking at.
A dump-only mode runs the extraction without calling Claude, at no token cost, and shows exactly what each endpoint and each .pbix returned. We used it to measure the gap between the two Power BI paths.
Two lessons from building it
Claude was the easy part. Given complete inputs, it writes clear documentation, and almost all of our effort went into getting complete metadata out of each platform. Had we built on the REST API alone, we would have shipped pages about datasets the tool knew almost nothing about, but measuring what each source returns before writing any prompt prevented that.
Readers also judge a documentation tool by its lowest quality outputs. One invented description, found by the wrong person, is enough for a team to stop trusting the rest of the docs. "Not documented" costs coverage and reads less smoothly than a full paragraph, and it is the reason teams can use the output.
Where to start
Documentation now serves both analysts and AI agents. Claude can write it, provided it works from real metadata and marks every gap it's unable to fill.
The four connectors in this post match the stack we worked with. Every connector feeds the same Claude core and follows the same rules, so adding a platform means writing one more connector: connectors for Notion, Tableau, Looker or Snowflake could be added the same way, next to or in place of the current ones. Each new one enriches the same single view of your data.
Want to know what an AI agent would learn from your documentation today? Get in touch with us at dataroots to try the tool on your own stack.
Built by Joël Gomez (Analytics Engineer) with Stijn Dolphen (Tech Lead) at dataroots.